In this unit we will:
Identify the different types of data
Describe the use of different types of data to explore answers to business questions
Identify a research question and justify the the use of different types of data
Data is all around us. It is first an observation of an event like number of store visits, and later might be observations of the result of a conceptual framework like customer satisfaction. Where we make a store transaction would result in latitude and longitude data. There is also data that describes other data like kilo-watt-hours as a unit of measurement for electricity usage.
We will examine both univariate (from Latin unus, one, and variare, to change) or one-variable data series as well as multivariate (from Latin multus, many) or arrays of univariate series.
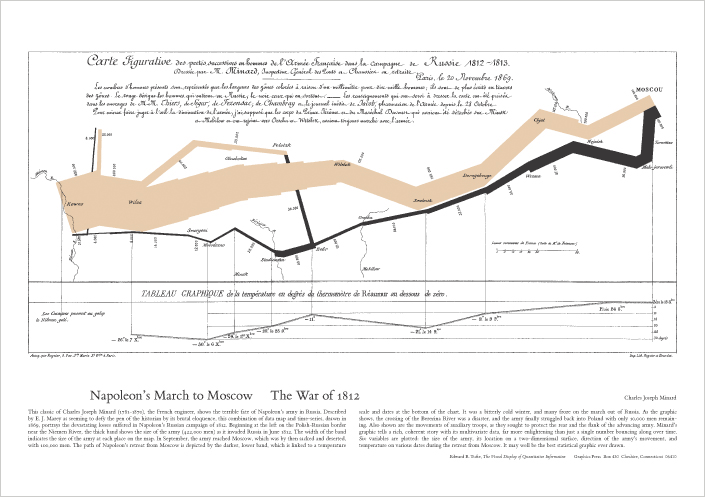
Here is a classic example of the many types of data we will confront.
Minard: Napoleon’s march to and from Moskow
How many data streams can you count in this graphic?
Businesses will often attempt to measure the impact of their operations on the populations they serve or are located near. Energy companies manufacture electricity, refined oil products, downstream basic and derived chemicals, and create polluting substances in the process. A California-based energy company wanted to gauge the impact of air pollution on births. Visit this EPA site for more information on the management of air quality.
Researchers collected data to examine the relationship between air pollutants and preterm births in Southern California. During the study air pollution levels were measured by air quality monitoring stations. Specifically, levels of carbon monoxide were recorded in parts per million, nitrogen dioxide and ozone in parts per hundred million, and coarse particulate matter (PM10) in \(\mu/m^3\). Length of gestation data were collected on 143,196 births between the years 1989 and 1993, and air pollution exposure during gestation was calculated for each birth. The analysis suggested that increased ambient PM10 and, to a lesser degree, CO concentrations may be associated with the occurrence of preterm births.
In this study, identify
the cases,
the variables and their types, and
the main research question.
A familiar example of a hierarchy is the organizational chart. This chart visualizes the reporting structure of an organization.
You can access this article about hierarchy for more information.
In each department of science there are hierarchies and networks of metadata. Metadata are data about data. Statistics mirror life, and in life we find ourselves classifying the world around us to make some systematic sense of it.
Here is a potential data classification hierarchy we might use with this research example.
Let’s lead with this summary:
| nominal | ordinal | interval | ratio | |
|---|---|---|---|---|
| categories: counts | x | |||
| order known | x | x | ||
| differences between values | x | x | ||
| add / substract values | x | x | ||
| fractions and multiples of values | x | |||
| frame of reference / zero value | x | |||
| differentiation / clustering | x | x | ||
| hierarchy / relational | x | x | ||
| system | x | x |
At the bottom of the hierarchy are four typical, and quite inclusive, classes of data:
Nominal (from the Latin nomen, name) label variables, without any reference to their quantitative content. This is first step in analysis: break down data into useful categories, assign labels, aggregate data according to the categories. Examples include any classification scheme, just like the data herarchy itself: gender, class section, resident county.
Building on nominal categories we have *ordinal scales (from the Latin ordo, ordinis, order) that rank levels of a variable from lowest to highest. There is no significance to the distance between ordinal scale levels, only the order is important. We might order customer satisfaction from a low level to a high level on a scale of 1 to 5. We might rank our prefewrences for beverages in which we might prefer milk (an ordinal value of 5) to beer (an ordinal value of 4), and so on. One level is simply better than another. As with nominal categories, ordinal scales do not contain any information about how much more we might prefer milk to beer.
Interval (from Latin intervallum, space between two walls) scales build both the order and the exact differences between the values. The classic example of an interval scale is earnings per share because the difference between each value is the same. For example, the difference between -1.20 and -1.19 EPS is a measurable 0.01 EPS in currency units per share of adjusted common stock, as is the difference between 0.01 and 0.02. Using interval scales we can measure entral tendency with mode, median, or mean; standard deviation can also be calculated. However, consider this: 1.12 EPS plus 1.12 EPS is 2.14 EPS. But the result does not necessarily mean that 2.14 EPS is simply twice as high as 1.12 since EPS can take on negative values. There is no such thing as no EPS. A zero EPS is not no EPS, it is just a measure of positive earnings less negative earnings. There is no baseline or frame of reference to compare EPS.
Ratio scales (from Latin ratio, explanation) use a base case, zero, to compute comparable levels of a variable. The maximium of a ratio scale can be any positive value. The minimum is zero. This allows us to compare as a fraction or multiple one value against another, thus providing a componennt of an explanation of the relative value of a variable. Using the example of a range of EPS from -1.10 to 1.20, we see that this is clearly an interval variable range. It is not yet a ratio scale. We would have to transform the series to a new scale where -1.10 is zero. We can do this by subtracting 1.10 from all values of EPS ranging from -1.10 to 1.20. This yields a new scale from 0 to 1.10. Only in this way can we faithly compare one EPSA to another. Thus an EPS of -1.05 is only 0.05 higher than -1.10 or 0.05/1.10 = 4.55% higher than -1.10.
The data classification hierarchy is a theory to be tested. A canon is a general law, rule, principle, or criterion by which something is judged. Let’s test this hierarchy against these canons of empirical method, expressed as questions for consideration (see and astrophysicist’s view of these canons, both based on Bernard Lonergan’s Insight, Longmans, London 1957, chapter III :
Relevance and Selection: Does the hierarchy use terms and relationships that hint at attributes in the data in the example? Does the hierarchy anticipate, and possibly raise further questions about the data? Does the hierarchy select relevant data and de-select irrevelant data.
sufficiency: If you use another node or relationship in the hierarchy, does that add anything new to the description that is relevant?
Parsimony: is the hierarchical description of data itself verifiable in the data?
Completeness: does this hierarchy account for all of the aspects you observe about data in this example? In other words, does the hierarchy somehow employ all of the data available, relevant, sufficient, and verifiable in this example.
| index | usage |
|---|---|
| 1 | 3 PM Mon 24th-Mar-2014___0.384 kwhNA_R |
| 2 | 5AM 15-Aug-2014___1.201 kwh5_C |
| 3 | 8PM Thu 20-Mar-2014__1.523 kwh_4_C |
| 4 | 6PM 23rd-Apr-2014___0.424 kwh_5_R |
| 5 | _1AM Friday 19th-Dec-2014___0.209 kwh_3_R |
| 6 | _5AM Tue 19th-Aug-2014___1.228 kwh_4_C |
All of the raw data is in a text string. We can parse the text into time of day, date, usage level, units of measurement, a quality rating (1-5), and a customer type ( R for residential and C for commercial) . Elements such as blank spaces and underscores (i.e., "_") would be eliminated as delimiters. Does the data type hierarchy still apply?
We have a mixture of categorical and numeric data in this data set. The data could be ordered by the time / data stamp when the observations of electrical usage were collected from meters. In this case we culd classify the data as a time series. One of the implications of this classification is that we might want to compare one time versus another. For example we could ask these questions: - Is morning usage different from nightly usage? - Are summar months’s usage different from winter months? - Is there a trend year to year? On the other hand we could view this data as a cross-section of usage sampled at verious times and classified by the type of electricity user or even by the ordinal quality of service series. In a cross-sectional context, we would view the data irrespective of time. However we can group the data into time buckets such as norming and night to aggregate customer usage. We can ask these questions of the data so arranged: - Are there different levels of usage among the types of customers? - Are qaulity of service levels different among the types of customers?
Why does any of this matter? The general question is bias and manipulation are possible if we fail to select all relevant, verifiable data that sufficiently describes and explains our research, decisions, and raises questions for further inquiry. - Systematic inquiry uses structures to name, associate, analyze, and conclude the properties of data - A proposed classification hierarchy anticipates the data used to analyze a pratical research problem - A test of the hierarchy using rules of empirical methodology confirms the validity of the classifications of the data and reaches into further questions for inquiry - A provisional structure helps us to identify and correct bias
Apply the data hierarchy to the county health outcome rankings and data base for states in the US. Find the types of data and apply the canons of empirical method to your findings. Choose Other measures > socio-economic factors for your investigation. You can navigate to this site for an interactive view.
Identify at least two examples each of nominal, ordinal, interval, and ratio variables.
Upon reading this report, are appropriate data types reach valid conclusions? For example, if a conclusion reached indicates that one segment of the sampled population is twice as large as the sampled population of another segment, are ratio measurement scales used?